Over the past decade data has seen a huge shift in both what it can deliver a business and how it can empower employees. Data can be used to gain the most relevant information required in a matter of clicks. However, many organisations still fail to deliver a simple but effective self-serve platform to really deliver on this promise. Self-serve analytics is key to gaining the most value out of a data platform and giving employees the tools to do their job right.
What is Self-Serve Analytics and Why is it so important?
Self-Serve analytics is a type of Business Intelligence, which enables and encourages employees to query data and create their own bespoke reports to answer any question they might have. It removes the legacy work and time previously handled by a software support team in delivering the outcome.
Why is it so important? Because data owners often know the business process and the correct calculations required. Previously, a ticket would have to be raised for a report to be created, often involving only marginal change to a current report, duplicating the information and building a large catalogue of “critical reports”. This often causes issues with maintenance of the reports and the cost of space . Self-serve analytics gives the users the ability to adapt and change their own reports as and when required without requiring assistance from elsewhere.
Why Change?
The shift in data use over the global pandemic has seen organisations dive into their own systems to understand the, what, how, where and when to track the most important KPI’s as we all evolve in these changing years. Most businesses now have:
• Technology focused employees who have the skills and desire to delve into the data world
• Cloud based applications which model and drive data transformation logic out of the box
• Easy access to the data from anywhere in the world to aid in business decisions
• Access to blogs, forums, and online training to enable employees to upskill and grow as individuals
The world has changed, and employees see the value in data-driven decision making and investing in the systems used. If an organisation doesn’t evolve to deliver effective self-serve analytics they will be left behind.
Data Strategy
A data strategy and data vision, enables an organisation to focus on the data it holds and to align systems and processes with data owners of all levels across the business. The data strategy will shift the culture of an organisation away from IT based applications into each department, aiding subject matter experts across all levels. Developing internal systems to transform the data into knowledge, training employees and embracing the change will build confidence in the data and improve system use for analytics leading to a data-driven workforce. The responsibilities held by data owners is significant and the need for effective self-serve analytics is clear.
How can Microsoft Power BI Empower Employees?
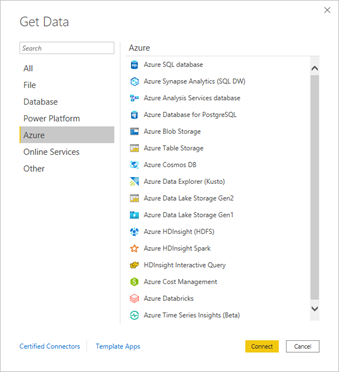
Power BI is desktop and cloud-based application, which can collate, manage, and analyse data from a variety of sources through a simple but effective interface. Using visuals and creating bespoke calculations one can generate a meaningful business process report, delivering insights not seen before. Using trends and AI features to interrogate data on a large scale give employees unique insights. Reports can be created, shared online and dashboards can be built to detail the key findings of data for Exec level information in a matter of clicks. It aids in self-serve and machine learning analytics.
How to create meaningful reports using Power BI
Power BI is centred around data and visualisation of the data. Once data has been imported or linked to Power BI and the data model relationships have been created the next step is to build a report which drives analytical value. If an organisation has a clear data strategy and training programme, employees will be ready to create meaningful analytics. Choosing the most appropriate visual is key to a successful report and empowers the employee to derive meaning in the data.
Slicer
A slicer will filter a report, page or specific visual over date, regions or similar.
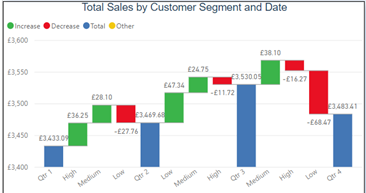
Waterfall chart
Gives the ability to visualise data over time, including positive and negative changes against the end result.
Area chart
This report can give more value to a line chart, with various shading options to give a good impact on more than one measure. More advanced options show the deviations of the area of the values.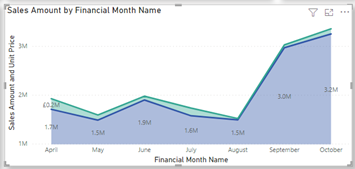
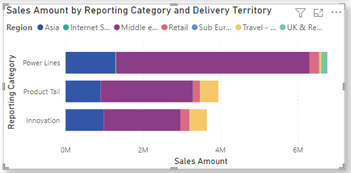
Bar chart and column chart
Simple but effective charts detailing the values over time typically used when focusing on a specific category or region.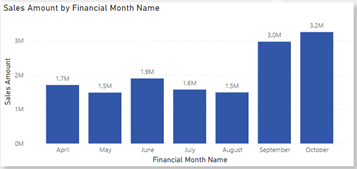
Matrix tables
Again, simple but effective and has the ability to drill down from a high level into row level detail. Great for visualising Profit and Loss over the year.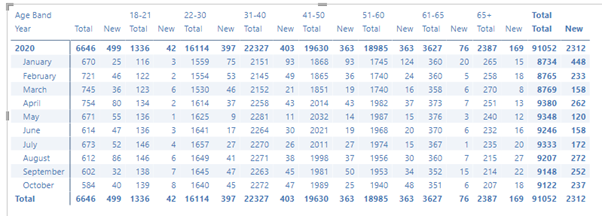
Custom Power BI visuals
Once an employee has mastered the simple visuals the Microsoft AppSource store has more advanced visuals, which a user can download (mostly for free). These give detailed insights into the data without requiring IT support.
Useful apps are the Bullet Chart, which aids in tracking values to targets in a single chart and Sparklines, which can help show trendlines of various values over time.
With the plethora of apps available and the ability to self-serve for both the data and visuals, employees now are empowered to build answers to complex business questions, without the need for IT support, delivering a true data driven process and new skills for the organisation. 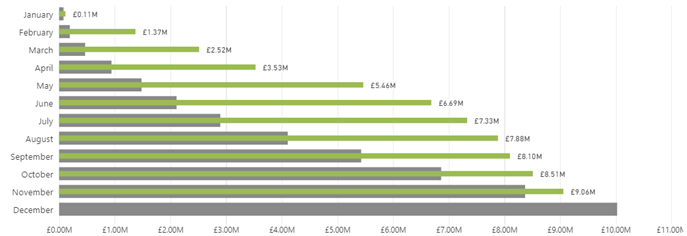
Advance AI and Animations
Once a user has got to grips with the usual reporting elements the next stage is to progress to more advanced elements including animations of visuals and AI features.
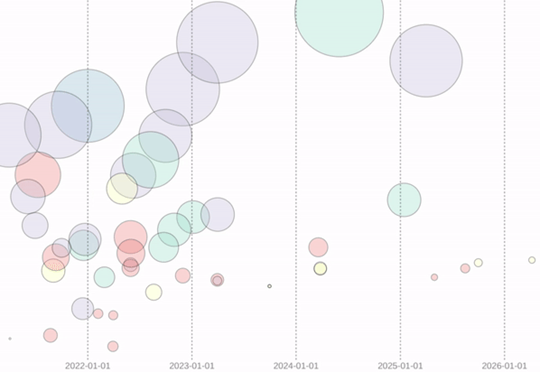
Animated Visuals
Adding animations to time based charts can help drive engagement into Power BI, give your reports emotion for the user and deliver the information in a clear message. A good example of an animated report is to show trends over time (for example where time is over many years). This allows the report creator to show larger amounts of data in the same space.
AI Features
Power BI has many AI features, capabilities and visuals which can empower employees to act on the data. One key feature is the Smart Narrative.
The Smart Narrative feature summarises all the visuals in the report, articulates key takeaways and highlights trends, by creating a narrative using natural language and dynamic values from the visuals. 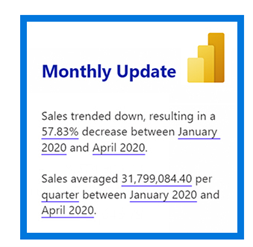
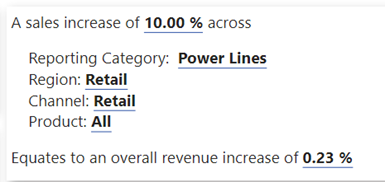
Being able to edit the natural language allows you to better communicate with your audience; use technical or non-technical terms as needed, arrive at key points quicker and explain the data to others in a way that works for them.
Dashboards and Apps
The final empowering element of Power BI is using the cloud-based service to build Exec based dashboards and an App to host multiple reports in a single simple service.
Dashboards
A Power BI dashboard is an online service where users can “Pin” multiple values from multiple reports to a single page. This page can be used as a high-level information overview, detailing key trends and KPI results. The visuals can be moved around the dashboard with only mouse clicks, dashboards are great for highlighting key facts of the data. Upon clicking any visual will take the user to the exact visual on a report page, allowing them to drill down to the line data if required. A dashboard can be personalised with a background image and colour schemes to keep it on brand.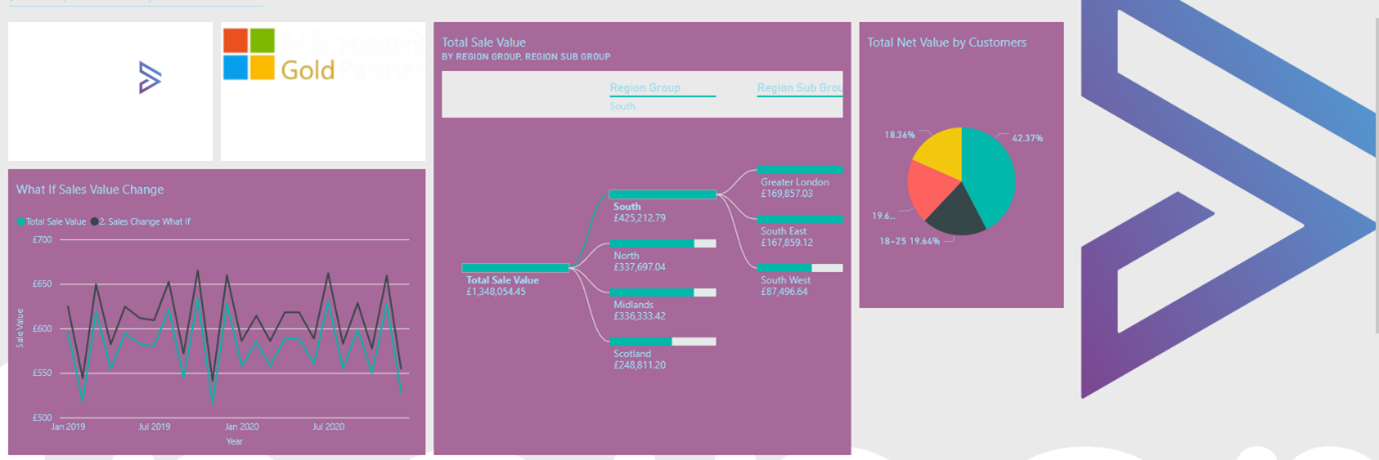
Apps
Power BI Apps can be created through the cloud service and are used to collate and bundle together reports, dashboards, datasets and more into a single user centric location. Apps are managed through admins of the tenant and have specific permission to control its use. The Power BI marketplace also offers many other Apps created by various organisations to deliver an application for specific data needs.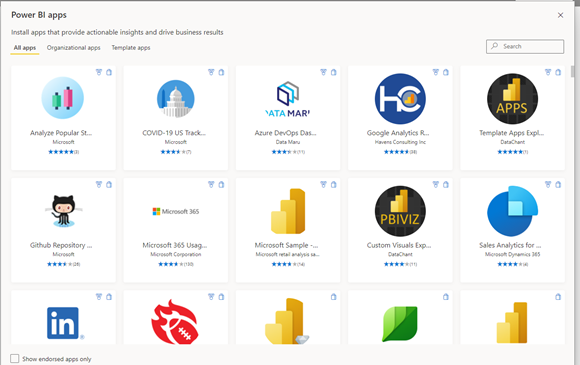
Using Power BI to enable Self-serve analytics drives meaning to businesses’ data strategies and helps solidify the reasons for putting data at the forefront of an organisation. Employees can gather data from multiple sources, model the information and turn data into meaning, using visuals and features to give insights for the wider company to use. Employees feel empowered to learn new skills and share their knowledge with the system and identify trends in the data not seen before. This will then drive engagement at the Exec level to view KPIs and business central information which drive change.