In a time where our datasets can be billions of rows with huge amounts of extra data being generated daily, data visualization tools leveraging Artificial Intelligence are invaluable in gaining valuable insights.
So what does "Artificial Intelligence" actually mean? According to Encyclopaedia Britannica, ”The ability of a digital computer or computer-controlled robot to perform tasks commonly associated with intelligent beings.”
Did you know that there are officially three main types of AI? Weak AI, Strong AI, and Super AI. Microsoft is investing so heavily in AI capabilities by incorporating it into all three categories of features in Power BI (data visualization, data preparation, and data modelling) that there really should be a fourth type Power AI!
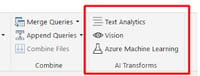
Microsoft announced in June 2020 that AI Insights in Power Query were generally available in Power BI Desktop, giving you access to a collection of pre-trained machine learning models that enhance your data preparation efforts. These include text analytics functions (sentiment scoring, key phrase extraction and language detection), image detection as well as connectivity to Azure ML models. As a leading data visualization tool, Power BI now has a comprehensive set of industry leading AI capabilities natively built in to help with data analysis and exploration. It can find patterns, predict future outcomes and transform data into something more understandable for the end-user.
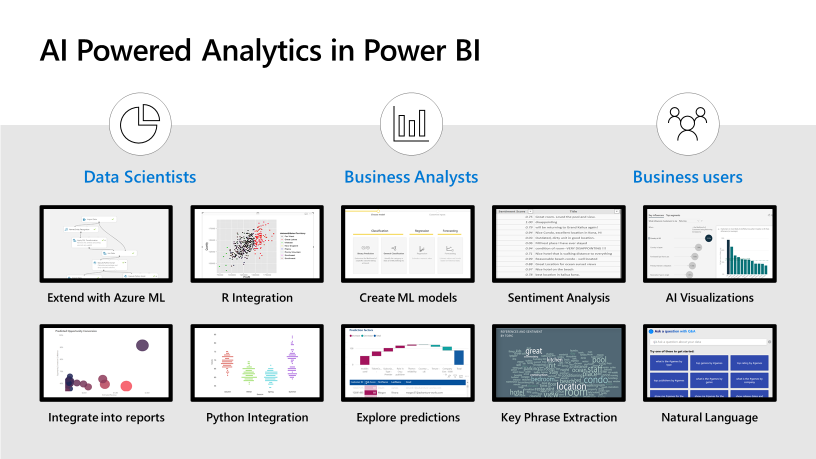
These features make AI more accessible for Power BI users (whether business user, analyst, or data scientist), helping your employees explore your data, automatically find patterns, understand what your data means, and predict future outcomes to drive business results. The new AI capabilities—pioneered in Azure and now available in Power BI—require no code, enabling all Power BI users to discover hidden, actionable insights in your data and drive better business outcomes.
Now we've had a short primer on AI in Power BI, you were promised 3 reasons for why Power BI is the ideal data visualization tool for AI in 2021.
Whilst not listed as a reason here, the fact that Microsoft is investing such huge amounts of money into AI has to be a consideration, with that said there are 3 primary reasons for using Power BI for your AI needs in 2021:
- Visualisation
- Insight
- Machine Learning capabilities
Reason 1: Power BI AI Visuals
The key influencers visual helps you understand the factors that drive a metric you're interested in. It analyses your data, ranks the factors that matter, and displays them as key influencers.

The decomposition tree visual in Power BI lets you visualize data across multiple dimensions. It automatically aggregates data and enables drilling down into your dimensions in any order. You can ask it to find the next dimension to drill down into based on certain criteria. This makes it a valuable tool for ad hoc exploration and conducting root cause analysis.

The Smart narrative visualization helps you quickly summarize visuals and reports by providing relevant out-of-the-box insights that are customizable. Using this feature, creators can add narratives to their report to address key takeaways, point out trends, edit the language, and format it to address specific audiences

Creators will be able to enrich their charts with automatic anomaly detection for time series charts. When a user selects an anomaly, that selection will trigger a further analysis that explains the anomaly. These explanations can be customized by the report creator.


Reason 2: Power BI AI Insights
With Text Analytics and Vision in Power BI, you can apply different algorithms from Azure Cognitive Services to enrich your data in Power Query.
-
Sentiment Analysis
The Score Sentiment function evaluates text input and returns a sentiment score for each document, ranging from 0 (negative) to 1 (positive). This function is useful for detecting positive and negative sentiment in social media, customer reviews, and discussion forums.
-
Key Phrase Extraction
The Key Phrase Extraction function evaluates unstructured text, and for each text field, returns a list of key phrases. The function requires a text field as input, and accepts an optional input for Culture info.
Key phrase extraction works best when you give it bigger chunks of text to work on. This is opposite from sentiment analysis, which performs better on smaller blocks of text.
-
Language Detection
The language detection function evaluates text input, and for each field, returns the language name and ISO identifier. This function is useful for data columns that collect arbitrary text, where language is unknown. The function expects data in text format as input. Text Analytics recognizes up to 120 languages.
-
Image Tagging
The Tag Images function returns tags based on more than two thousand recognizable objects, living beings, scenery, and actions. When tags are ambiguous or not common knowledge, the output provides hints to clarify the meaning of the tag in context of a known setting.
Reason 3: Power BI Auto ML
- Removes the need for complex data science resources for basic predictive models.
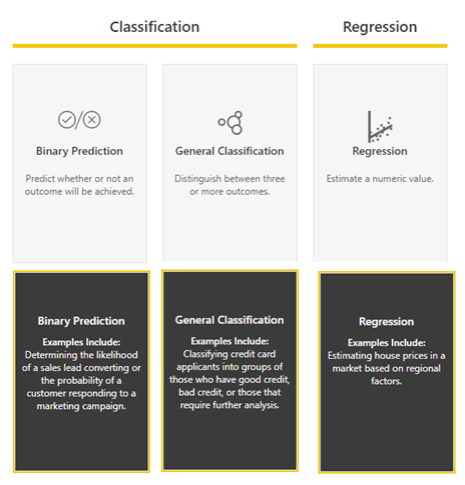
- Automate model selection based on input data set
- Automated feature selection based on automated correlation assessment
- Automated training and testing data split (80/20)

As one of the leading data visualization tools on the market, Power BI allows you to leverage AI to deliver value to your business. Ready to find out more?